

Examiners are more carefully scrutinizing banks’ lending penetration in low- and moderate-income census tracts for CRA and in substantially minority census tracts for Fair Lending in banks’ designated assessment areas. Examiners also expect banks to demonstrate a thorough understanding of their lending patterns.
For example, they analyze HMDA loan data and Small Business/Small Farm loan data and geocode loans to develop reports and maps.
The reports, containing banks’ lending patterns, are then compared to peer banks to ensure similar lending percentages in high-risk areas.
Banks showing below-peer performance during several exams and that fail to implement a strategy for increasing the percentage to line up with peer banks’ levels are at risk of being cited for redlining.
Annual Lending Analysis – Upward Reporting Mitigate Risk
During CRA and Fair Lending exams, examiners often talk with Bank Management or Board members, not the Compliance or CRA Officer, about lending patterns.
They want to determine whether there is a deep understanding of the bank’s loan penetration and the demographics of an assessment area. If Managers or Board members lack appropriate knowledge of lending patterns, it’s a red flag that indicates the bank may be unaware of its lending patterns.
You can reduce your risk by conducting an annual lending analysis that includes a three-year trend for penetration in low- and moderate- income census tracts for CRA and in substantially minority census tracts for Fair Lending within your designated assessment area.
Reporting findings to your Compliance Committee, Audit Committee, and Board is also essential. The minutes of these committees prove your commitment to keeping Management and the Board informed. Additionally, the minutes can document your action plan to improve the percentages if needed.
Prepare for Greater Scrutiny, Tough Questions
Some of our clients have mentioned that regulatory agencies have been asking about how their small business and small farm loan penetration is in the substantially minority census tracts in their delineated assessment area.
For assessment areas with minority census tracts identified as a predominate minority race or ethnicity group, such as Black and Hispanic, agencies are examining the lending penetration percentage of the bank compared to peer banks for those census tracts.
Many banks are flabbergasted by such questions and often struggle to answer them. Moreover, they seem to be precursor questions that would be asked in a future 1071 Small Business Data Collection exam.
Thus, it’s smart to perform a lending analysis of the small business and small farm loans to determine the lending penetration in the substantially minority census tracts as well as loan penetration in identified Black and Hispanic census tracts. Data mapping would provide additional insight.
Also, if you’re not geocoding loans and entering the data into your LOS, we strongly advise you to start doing so.
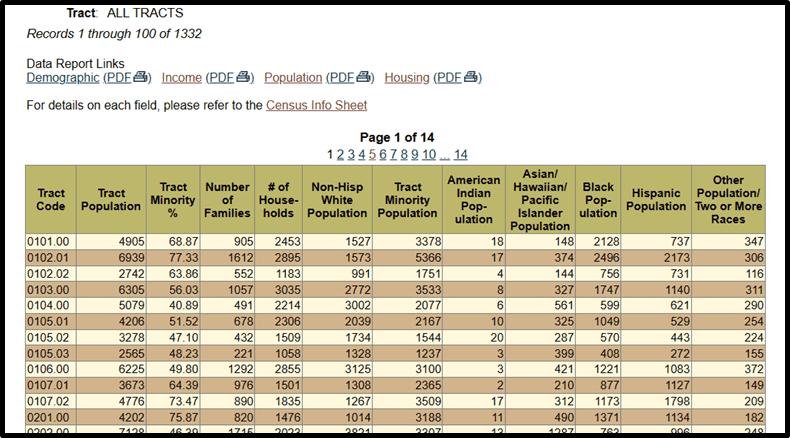
If you don’t have software to identify the demographics of each census tract’s minority population, see the FFIEC Census and Demographic Data (https://www.ffiec.gov/censusproducts.htm).
Once in the listing of tracts for the selected county, click on the population link. In the sample screenshot below, census tract 0101.00 is a substantially minority tract and a designated majority Black population census tract. Census tract 0107.02, a substantially minority tract, is a majority Hispanic population census tract.
If you need help understanding your lending patterns, give us a call. TCA will always find A Better Way to get the job done.
TCA – A Better Way!


